Measure your email marketing performance with Websand
You’ve created your customer groups, your email message and made the campaign live. Now the important bit. The results, understanding what happened. Who opened, who clicked, who bought.
Using the Websand dashboards within your Marketing CRM. You’ll understand the performance of your email marketing campaigns as well as the overall performance of your business.
Measure your email marketing effectiveness
Websand provides a top line marketing dashboards to show you the key insights you need to measure to continually improve your email marketing performance.
All deliveries, opens, clicks, bounces, unsubscribes and spam reports are reported for each campaign and automation you send through Websand.
Explore by individual, campaign or automation to generate the insights you really need.
Alternatively, segment your audience based on who did what and when to maximise your email marketing performance.
Insights from the customer dashboard
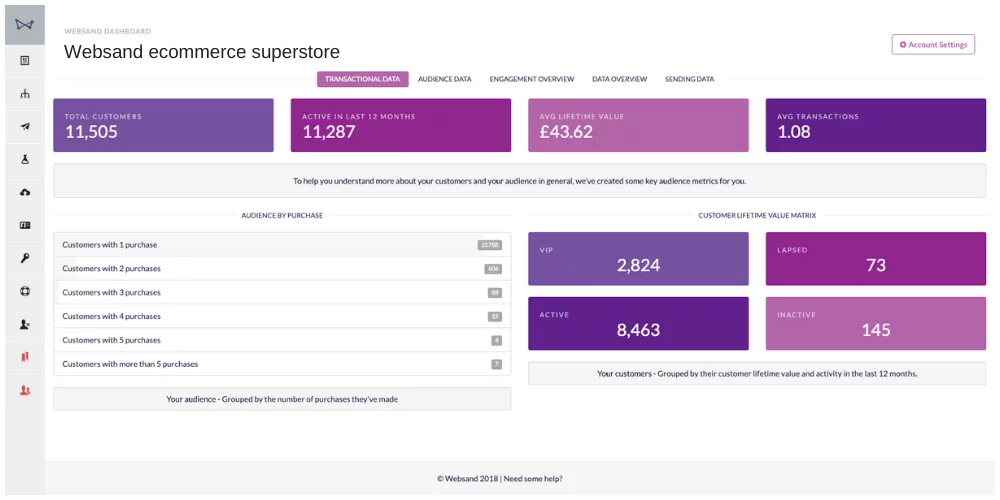
The Websand dashboards tell a story. The home dashboard shows you how many customers you have, how much they are worth, and how active they are.
Understand the average customer lifetime value of your business, and how many customers are above that value and how many are below.
The frequency table shows how many times each of your customers has purchased from you. Typically, the drop from 1 purchase to more than 1 purchase can be as high as 90%, so purchase frequency is a key metric to help you create targeted email campaigns and drive repeat sales from your customers.
Measure your overall email marketing engagement
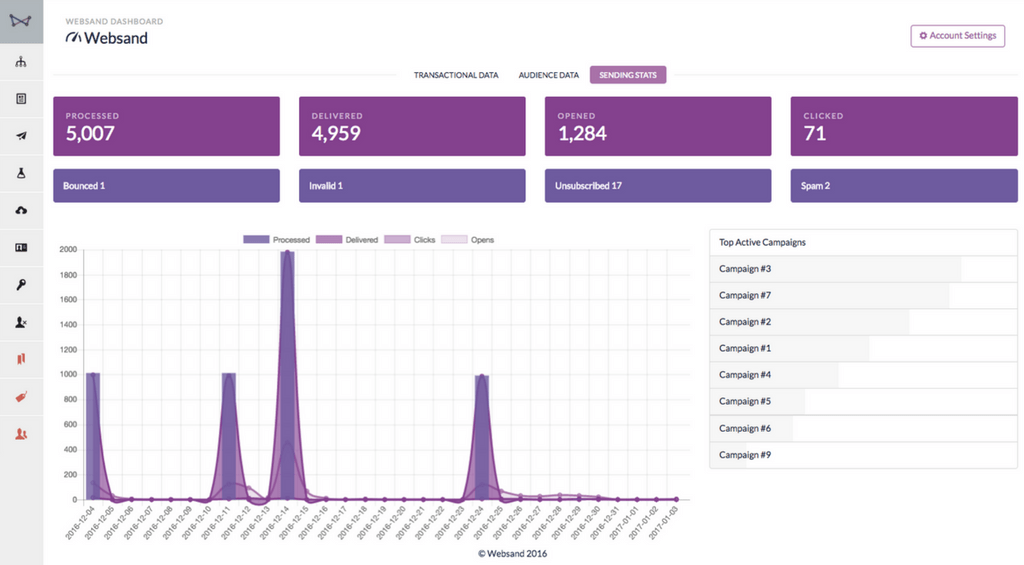
The send tab from the Websand home page shows your overall email marketing performance over the last 30 days. The graph shows the combined email performance of all the active campaigns (automations and traditional send campaigns).
Understand how many people have engaged with your email marketing over the last 30 days. Click through on the Active campaign name and you can explore the individual campaign performance in more detail.
As a benchmark for overall performance, you want the delivered to opened percentage over the period to be at least 30% and your open to click to be at least 10% (that is 10% of opened emails are clicked).
Your new Marketing CRM
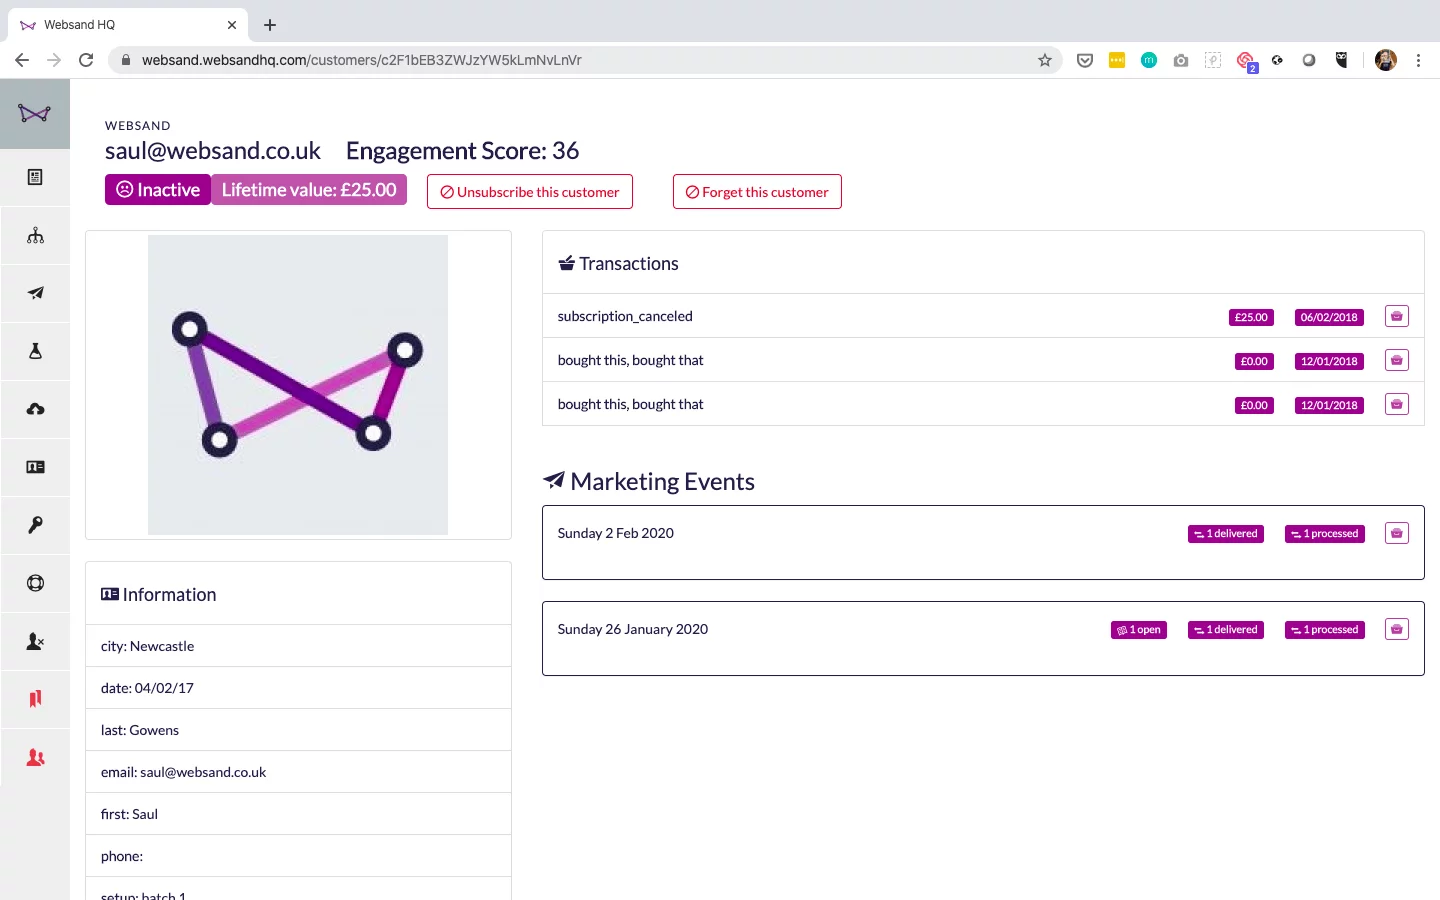
Websand is built on the data you collect about each individual, who they are, what they’ve bought from you and how they have reacted to the email marketing you’ve sent from Websand.
The audience dashboard allows you to view the depth of information against each individual, a typical marketing CRM screen. Understand in more detail, who they are, what they bought, when they bought it and their total customer lifetime value. Which email campaigns they’ve received and how they’ve reacted to it.
Access the detail for each individual record within Websand by clicking on an email address anywhere in the platform. Be that from the Audience tab from the home page or within a segmentation screen.
Measure your email marketing effectiveness by campaign
The Campaign page from the Websand menu allows you to create new campaigns, edit existing campaigns and review the email marketing performance of live and previously active marketing automation campaigns you’ve conducted through Websand.
To review performance of your selected campaign, click on your selected Campaign from your Campaign list.
See the overall performance of your campaign, and how that performance has built up over time.
Click on any of the boxes at the top of the campaign screen to create a segment for that audience.
To find out more about typical benchmarks, read this blog post about email marketing performance.
Understand your marketing automation performance
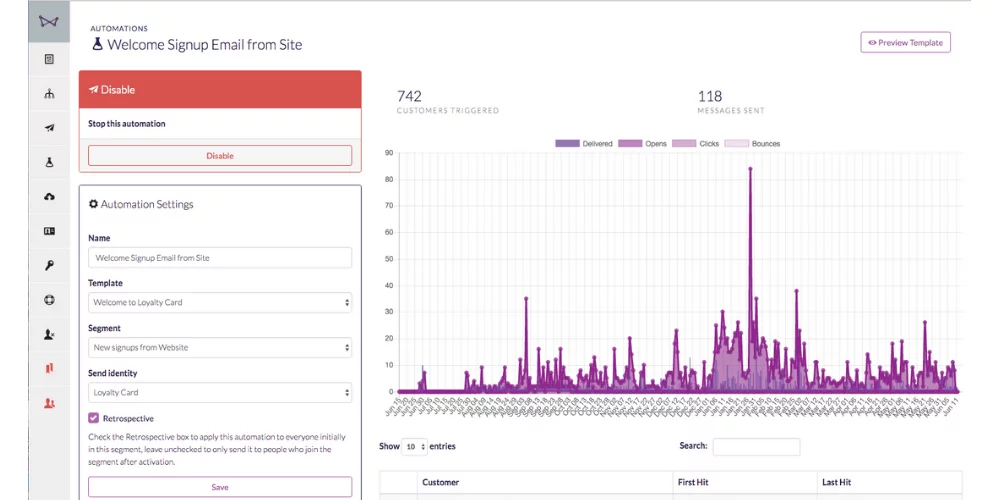
The reporting for the automations is slightly different to the other screens. Access your automations through the automations screen, and then click through to see the activity for the automation.
A graph showing the engagement over time, and a list of those people included in the automation.
If you want to know more detail, create a marketing segment to understand more about who has received, opened or clicked an automation.

It’s time to start getting more from your email marketing
Sign up for a free Websand demo and let’s show you how to get the best from your email marketing.