
Getting to grips with Cohort Analysis
If you are collecting customer data, cohort analysis is can be a hugely valuable tool to help you understand business performance, especially if you are running a successful fast moving e-commerce subscription business.
Our friends at Bearded Colonel, not only know how to provide fantastic shaving kit for the discerning modern gent. They also know more about managing cohorts than a Roman general.
So, over to you Tyvand McKnee, founder of Bearded Colonel, and his thoughts on Cohort Analysis.
And, full disclosure alert, Bearded Colonel is a Websand client.
The importance of cohort analysis
When it comes to your mountain of unorganized data, cohorts are your best friend. Not only will they allow you to break down your data into digestible pieces, they’re also a far more accurate way to analyze it than as a whole.
Taking the Customer Lifetime Value (LTV) example
Let’s take lifetime value (LTV) as an example. It might be tempting to simply take the sum of all of your sales and divide by total customers (sales/customers=LTV). While that is a metric, it does a terrible job of giving you an accurate number, or a full picture of what’s going on.
Perhaps most of your customers make their biggest purchase with you 3 months after their first (whether you know that they do or not). Let’s say 2 months ago you made a massive marketing push that saw you make twice as many sales as the previous 6 months.
That surge of new customers is going to warp your numbers as they haven’t made their biggest purchase yet; you’ll get a LTV that is lower than your actual LTV.
If you move forward with this number, you’ll be committing yourself to slower growth than what you could actually realize (due to reducing marketing budget/customer).
A similar and inverse situation (which is worse) is thinking the LTV is much higher than it really is, and you could be acquiring customers at a loss.
You can use cohorts for just about anything: LTV, retention/churn, effectiveness of cross selling systems, or general customer habits.
~Websand interruption~.
Understanding customer lifetime value can be tough for a business, and can get complex. Tyvand is an expert, but we find proving the user with an overall LTV indicator, gives them a great starting point to go deeper with their understanding and creating cohorts based on the value that customers are creating. Our thoughts understanding customer lifetime value on that in more detail can be read here.
Using cohort analysis
Let’s get strategic. What you’re seeking to find out is going to determine how you make your cohorts.
If you’re looking for churn/retention rates, or LTV after X time, you’ll want to break them down based off of time (group them by which month or week they joined or became a customer).
Then track them as a group over that unit of time. A retention graph based on monthly cohorts will like THIS.
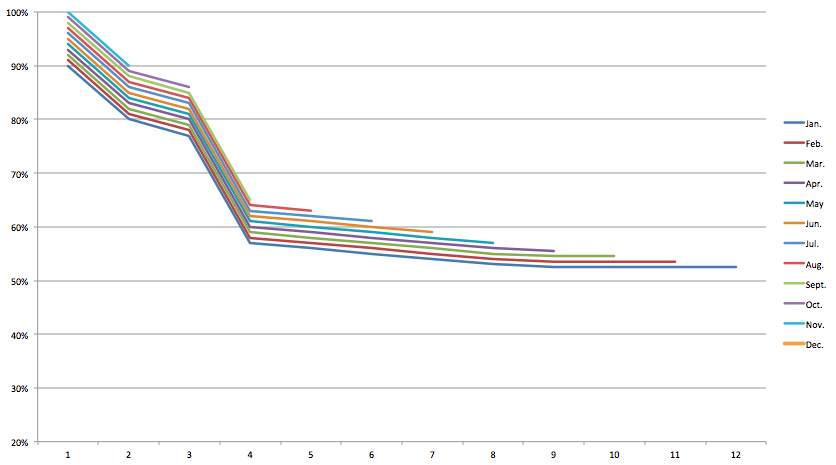
Each line represents a monthly cohort and shows the % retained after X months.
It’s a very simplistic graph, but if yours looks like this, you’re doing pretty well; in the last 12 months you’ve increased retention by 10% (notice how each line is a little higher than the previous, perhaps you’ve been rocking your on boarding) and you have only 1 major drop in month 4 that needs addressing (more on that later).
You can also use your cohorts to dive into finer details to max out the efficiency of your marketing.
Get into the deep detail
If one marketing campaign has an average CPA (cost per acquisition) of £10 and the other £5, you’d be excused for thinking that you should pile all your cash into the £5 one.
However, if customers from the £10 are spending 7x (or are far more active on your platform, whatever is important to you) as much as those from £5, you’d be wrong to do so.
In this case you’ll want to group your data by their source (Facebook, Google, referrals, and so on). Note, it would be wise segregate your data points by source AND by date as with retention.
This will give you an even clearer picture; You might see something such as, users from Facebook cost £10 each and in the first 2 months spend as much as users from Google, but 50% of them make a huge purchase in month three.
With that, you might decide that Facebook has the best ROI, but you have a 2 month goal you want to meet (perhaps to impress an investor), so you’ll load up your Google campaigns for 2 months, then switch focus to Facebook.
~Websand interruption~.
The explanation above is why we’ve made source a mandatory field within Websand. Understanding where people came from, how much that cost you and how much value they create is hugely valuable.
Using Cohort Analysis to grow your business
Cohorts are also great for looking into habits of your users. Cluing you in on when is the best time to cross sell to them, or when they need extra attention.
Let’s say you’ve got 12 monthly cohorts for the last 12 months, and you’re noticing a big drop for each cohort on their 4th month.
Perfect, you now know that something happens here, and you can run some tests to figure out what’s up.
Maybe they need a little extra love to get them to stay on. If you’re lucky they’ve outgrown your basic offer and started shopping around with competitors. That’s the opportunity to get them to upgrade to your premium offer.
You’ll never get that sort of insight without cohorts, I don’t care how good your CRM is; data is faster, clearer, and numbers don’t lie or sugar coat.
This is only the tip of the iceberg, but hopefully I’ve convinced you to start using cohorts.
If you’ve made it this far in the article, there’s a good chance you haven’t read Lean Analytics by Eric Reis. I strongly recommend you do so (click here to visit the website, and you can download a book of valuable case studies).
The book will fill in all the details on how to calculate and sort your data with cohorts.
One final note, while data analysis is much easier if you can code or if you know Excel macros, you don’t need it to get great data. I know only a handful of excel shortcuts, but with a little clever thinking, I can easily organize and analyze my data. Good luck!
Tyvand McKee (CEO/Founder – Bearded Colonel)
Let us taking the hassle out of managing your cohorts
And we are back, thank you Tyvand.
As I said earlier, Tyvand clearly uses cohort analysis a lot. He spends valuable time to focusing on how much value customers they are generating for the Bearded Colonel.
I’m delighted to say that The Bearded Colonel are using Websand. I’m really excited to see how they are going to use our platform to manage their cohorts and make the Bearded Colonel even more successful.
If you are looking for a platform to help you manage your cohorts, improve your marketing and generally make your life easier. Follow Tyvand’s lead and sign up or book on the calendar below.